GreatBless Help Center
Trading Analysis

What is the Sharpe ratio?

The Sharpe ratio is an indicator that measures the return generated per unit of risk taken in trading. A higher Sharpe ratio indicates better risk management performance.

  • Sharpe ratio > 1: A good strategy; the returns generated are well worth the risk taken.
  • Sharpe ratio < 1 (or negative): The risk is too high compared to the returns generated, or the account is currently trading at a loss.

Here is how to calculate the Sharpe ratio:

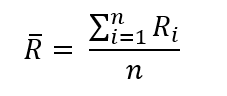
Step 1: Calculate the Average Return

The system calculates the average daily return by summing all daily returns and dividing by the total number of trading days.

In which:

  • \(\bar{R}\): Average daily return. This is the mean return, calculated by adding together all the individual daily returns and dividing by the total number of trading days.
  • \(R_i\): The return on a specific individual trading day.
  • \(\sum_{i=1}^{n} R_i\): The sum of all daily returns from the first day (\(i=1\)) to the last day (\(n\)).
  • \(n\): The total number of trading days.

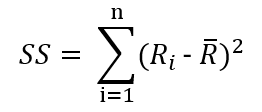
Step 2: Calculate the Variance

The system measures how much each daily return differs from the average return by calculating the squared difference for every trading day and summing the results.

In which:

  • \(SS\) (Sum of Squares): The Sum of Squared deviations.
  • \((R_i - \bar{R})^2\): The squared difference between the return on a specific day and the average return. (Squaring the difference ensures the result is positive and highlights larger deviations).
  • \(\sum_{i=1}^{n}\): The sum of all these squared differences from the first day to the last day.
  • \(\bar{R}\): Average daily return.
  • \(R_i\): The return on a specific individual trading day.
  • \(n\): The total number of trading days.

Note: At this stage, the system only calculates the sum of squared deviations. The division is performed in the next step when calculating the sample standard deviation


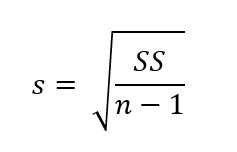
Step 3: Calculate the Standard Deviation (Risk)

The system calculates the sample standard deviation by dividing the variance sum by (n−1) and then taking the square root.

In which:

  • \(s\): The sample standard deviation. This serves as the primary measure of risk or volatility of the trading returns.
  • \(SS\): The Sum of Squared deviations, as calculated in Step 2.
  • \(n - 1\): Degrees of freedom. Dividing by \(n-1\) (instead of \(n\)) provides a more accurate and unbiased estimate of the standard deviation when working with a sample of data.

This value represents the volatility (risk) of the trading returns.


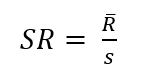
Step 4: Calculate the Sharpe Ratio

The Sharpe Ratio is calculated by dividing the average return by the standard deviation.

The system assumes the risk-free rate is 0, so the formula becomes:

In which:

  • \(SR\): The Sharpe Ratio.
  • \(\bar{R}\): The Average daily return.
  • \(s\): The standard deviation of the daily returns (Risk).

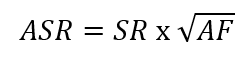
Step 5: Calculate the Annualized Sharpe Ratio

To annualize the Sharpe Ratio, the system multiplies the Sharpe Ratio by the square root of the annualization factor.

  • Annualization Factor = Number of trading periods in one year.
  • Common values include:
    • 252 for daily trading returns (stocks/forex)
    • 52 for weekly returns
    • 12 for monthly returns

For daily returns, the formula becomes:

$$ \text{Annualized Sharpe Ratio} = \text{Sharpe Ratio} \times \sqrt{252} $$

Example Calculation

Suppose a trader has the following daily returns over 5 days: 1%, 2%, -1%, 0.5%, 1.5%.

Here is how the system calculates the Sharpe ratio based on these figures (converting percentages to decimals for calculation: 0.01, 0.02, -0.01, 0.005, 0.015):

Step 1: Calculate the Average Return

$$ \bar{R} = \frac{0.01 + 0.02 - 0.01 + 0.005 + 0.015}{5} = \frac{0.04}{5} = 0.008 \text{ (or 0.8%)} $$

Step 2: Calculate the Variance (Sum of Squares)

Subtract the average from each daily return and square the result:

  • Day 1: \( (0.01 - 0.008)^2 = 0.000004 \)
  • Day 2: \( (0.02 - 0.008)^2 = 0.000144 \)
  • Day 3: \( (-0.01 - 0.008)^2 = 0.000324 \)
  • Day 4: \( (0.005 - 0.008)^2 = 0.000009 \)
  • Day 5: \( (0.015 - 0.008)^2 = 0.000049 \)

$$ SS = 0.000004 + 0.000144 + 0.000324 + 0.000009 + 0.000049 = 0.00053 $$

Step 3: Calculate the Standard Deviation

$$ s = \sqrt{\frac{0.00053}{5 - 1}} = \sqrt{0.0001325} \approx 0.01151 \text{ (or 1.151%)} $$

Step 4: Calculate the Sharpe Ratio (Daily)

$$ SR = \frac{0.008}{0.01151} \approx 0.695 $$

Step 5: Calculate the Annualized Sharpe Ratio

Assuming 252 trading days in a year:

$$ \text{Annualized SR} = 0.695 \times \sqrt{252} \approx 0.695 \times 15.874 \approx 11.03 $$

Conclusion: An annualized Sharpe ratio of 11.03 indicates an exceptionally good risk-adjusted return over this period.

💬 Need more help?

Chat with our support team or submit a ticket — we reply within 24 hours.

Open support page

Other articles