Understanding Trading Stats & Analytics
The Reports & Trading Stats panel in WebTrade provides objective, institutional-grade analytics on your trading history. By evaluating your execution patterns through mathematical metrics rather than emotional intuition, you can identify hidden strategy flaws, track drawdown resilience, and optimize risk-adjusted returns.
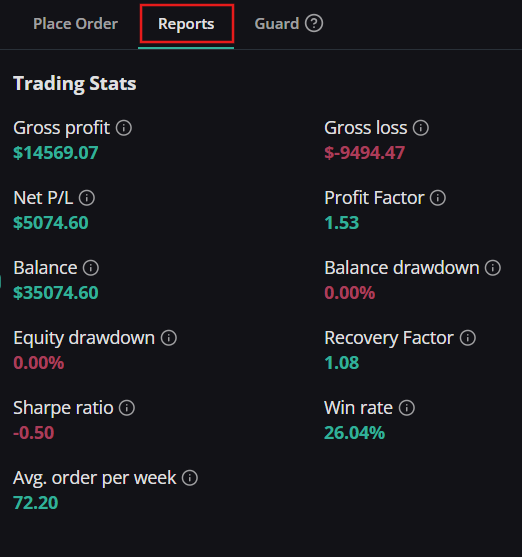
Key performance metrics explained
- Gross Profit: The total cumulative profit generated across all winning trades during the evaluated period.
- Gross Loss: The total cumulative loss incurred across all losing trades.
- Net P/L: The net realized financial outcome (
Gross Profit - Gross Loss). - Profit Factor: The ratio of Gross Profit to Gross Loss (
Gross Profit / Gross Loss). A Profit Factor above 1.0 indicates overall profitability; professional trading systems typically target 1.5 to 2.0+. - Balance: The closed account value after accounting for realized trades and funding transactions, excluding active floating P&L.
- Balance Drawdown: The maximum percentage decline in closed account balance from its highest recorded peak to its subsequent lowest trough. See Balance Drawdown.
- Equity Drawdown: The maximum percentage decline in total account equity (including active floating profit and unrealized loss) from its peak. This metric captures open-trade risk and market exposure. See Equity Drawdown.
- Recovery Factor: Measures how efficiently a strategy overcomes its worst drawdown period (
Net P/L / Maximum Absolute Drawdown). A higher score demonstrates strong capital recovery. - Sharpe Ratio: Measures risk-adjusted return relative to portfolio volatility. It illustrates whether returns are derived from smart strategic edge or excessive risk exposure. See Sharpe Ratio.
- Win Rate: The percentage of winning trades relative to total closed trades (
[Winning Trades / Total Closed Trades] × 100). Note that a high win rate does not guarantee profitability if losses are significantly larger than gains. - Avg. Orders Per Week: Evaluates trading frequency across active weeks (
Total Orders / Number of Active Trading Weeks). Helps determine if a trader is overtrading during volatile market conditions.