Reading Your Backtest Results
All trading activity produced during a Backtest session is presented in the familiar bottom and side panels, populated entirely by your simulation data.
The bottom panel
While Backtest is active, the bottom panel features four dedicated tabs: Open Positions, Pending Orders, History, and Balance / Equity. None of this data interacts with your live account, and the Deals sub-tab under History is hidden because the simulation executes orders locally.
- Open Positions: Displays active simulation trades alongside real-time metrics for Balance, Equity, Used Margin, Free Margin, and Margin Level.

- History & Chart Trade Markers: Each closed position in the History tab includes interactive chart tools:
- Eye icon on each row: Toggles visibility of that trade's chart markers (entry arrow, connecting line, and exit dot).
- Eye icon in table header: Toggles visibility of all historical trade markers at once.
- Clicking Open time or Close time: Immediately pans the chart viewport to that exact entry or exit candle. The target marker highlights in amber so you can easily spot it.

The Balance / Equity tab
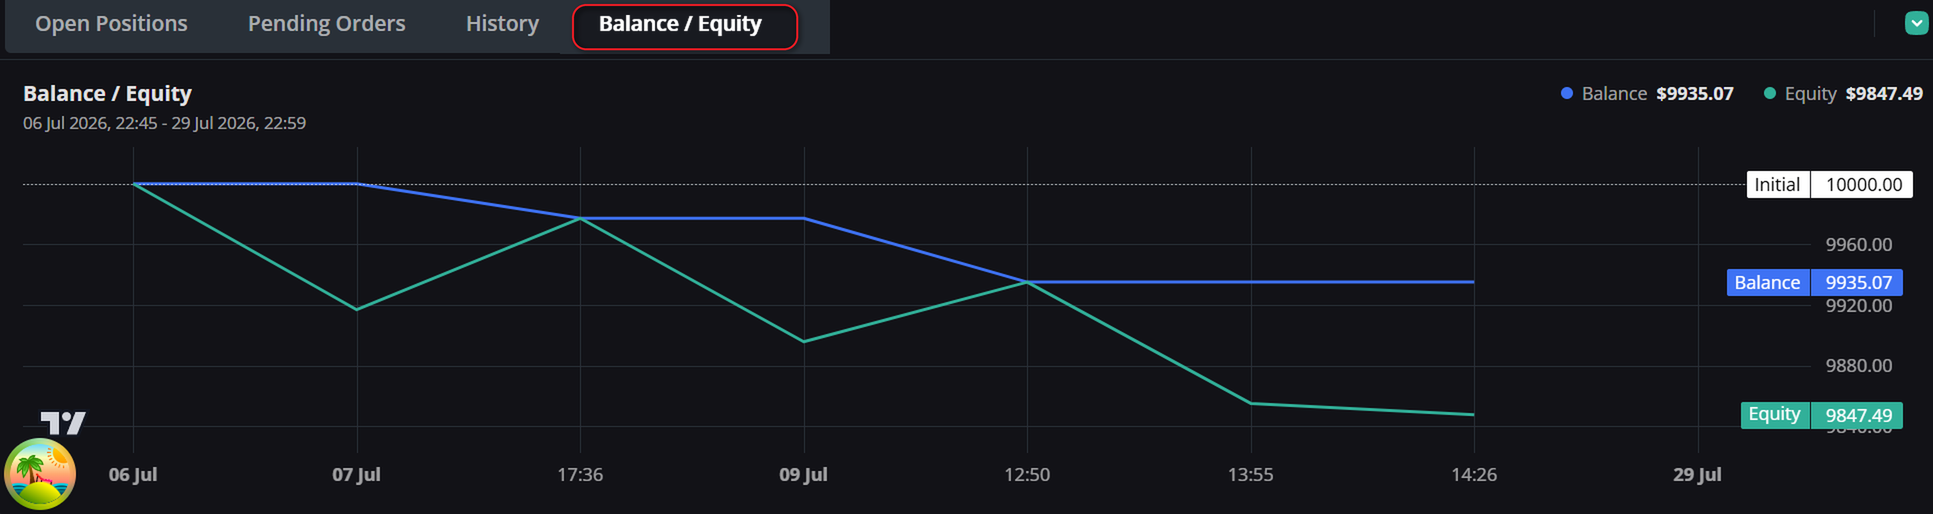
The Balance / Equity tab plots your simulation performance curve across 5 specific trading events (rather than per-tick price fluctuations):
1. Market order opened : records initial equity and margin state.
2. Pending order filled : logs entry execution.
3. Position closed (full or partial) : records realized profit or loss and updated balance.
4. Stop Loss (SL) or Take Profit (TP) triggered : logs automatic exit execution.
5. Automatic closeout at session end : settles remaining trades when the run completes.
The horizontal dotted Initial line indicates your starting demo deposit, making it easy to track whether your strategy is running in profit or drawdown.
Trading Stats & Performance Metrics
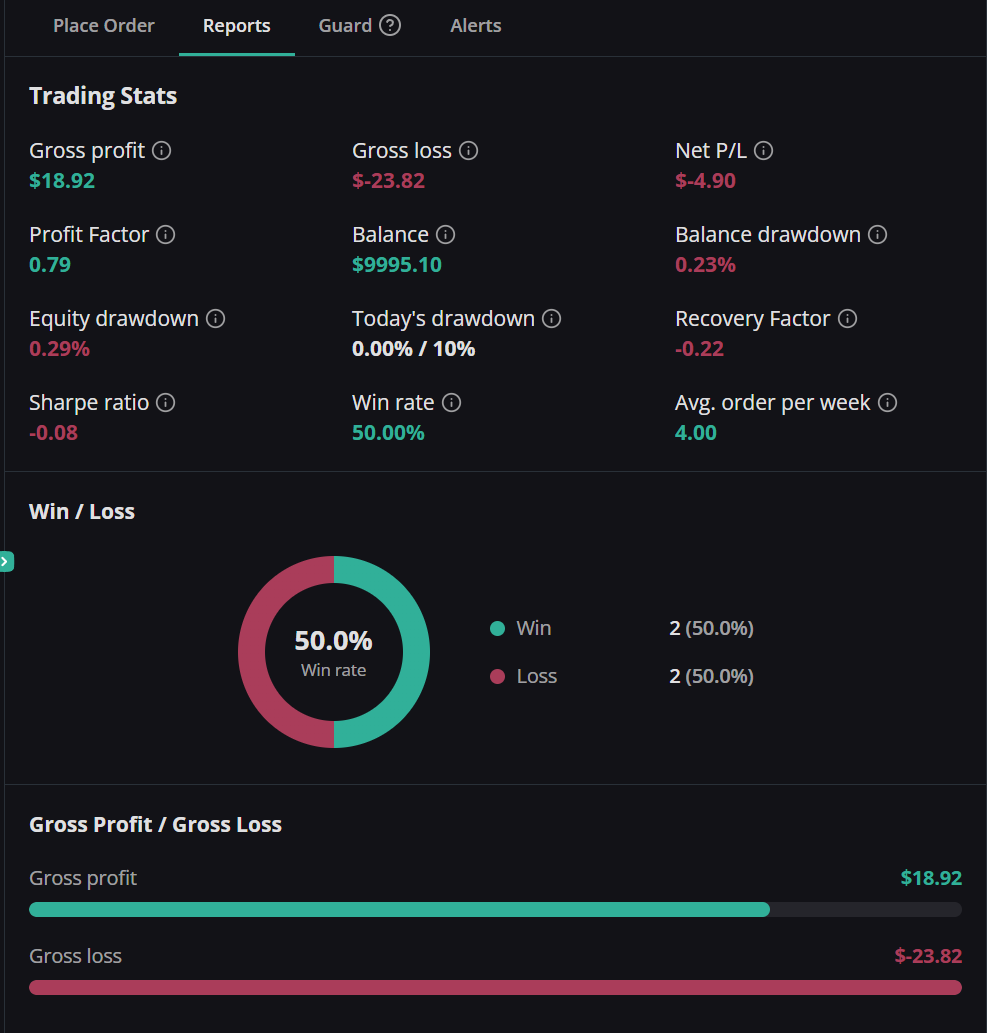
Comprehensive strategy analytics are accessible in the Reports tab of the right-hand panel (or as a fullscreen overlay on mobile devices). All key performance indicators are calculated directly from your backtest trading history:
- Key metrics: Gross Profit, Gross Loss, Net P/L, Profit Factor, Recovery Factor, Sharpe Ratio, Win Rate, Balance Drawdown, Equity Drawdown, and Average Orders per Week.
- Visual analytics: Win/Loss donut breakdown and a comparative bar chart contrasting Gross Profit against Gross Loss.
The Today's Drawdown metric is an account-level guardrail tied to your live account status. Disregard this specific field while analyzing simulated backtest results.
Finishing a session
A session concludes either when you click End or when the replay reaches the end of available historical candles. At that point:
- Any open positions without an active SL/TP are automatically closed at the final candle price.
- Any remaining pending orders are cancelled.
- The Backtest completed dialog appears, summarizing the finishing time, the number of settled positions/orders, and the total session Net P/L (colored green for profit, red for loss).
Click View report to simultaneously open the Balance / Equity tab and Trading Stats panel for an in-depth review.
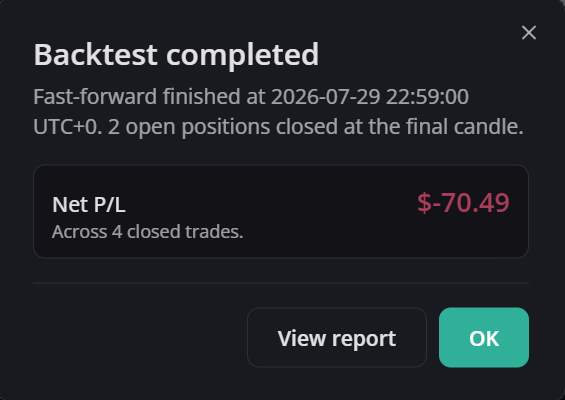
Once a run has ended, Play and Step are locked. You can start a fresh session at any time by selecting a new start point with Select bar or Select date.
Saving and restoring sessions
- Saving on exit: When leaving Backtest while a run is actively in progress, you are prompted with "Save Backtest state?". Choosing Save preserves the session in your browser's local storage; choosing Cancel exits without saving.
- Restoring on entry: When entering Backtest with a saved session present, a prompt asks "Restore Backtest state?". Selecting Agree restores all candles, time cursor, demo balance, leverage, open positions, pending orders, history, and the Balance / Equity curve. Selecting Cancel discards the saved session and starts fresh.
Saved sessions are stored locally in your browser's localStorage. Only one saved session is retained at a time, and clearing browser site data will reset it.